Is bike share contributing to DC’s growing cycling rates?
by Stefani Cox
December 18, 2017
Contributing editor: Michael Anderson of PlacesForBikes.
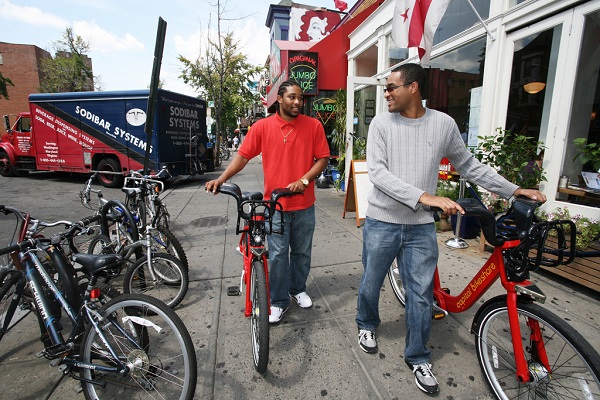
Source: DDOT DC via Flickr.
New population data shows that bicycling as a method for getting to work is on the rise — and we think bike share could be part of the reason why.
Every time new data gets released by the U.S. Census Bureau, it provides an opportunity to take stock of a variety of indicators about the health and wellbeing of the American populace, and this year is no different.
America Walks examined Census data to show how walking to work is on the rise in many cities across the country. It looks like the same story is true for bicycling as well, and we wonder if that might be due in part to bike share.
Having launched in 2008, DC is home to North America’s oldest bike share program. The number of years that the system has operated makes it an ideal one to look to when assessing long-term impact.
Increases to cycling commuters across the board
Based on a comparison of estimates from the American Community Survey 2012-2016 and 2006-2010 data, bicycling rates as a means for getting to work are up across a multitude of demographics.
Drilling down by demographic means that, due to sample size, we can only look at the broad category of “taxi, motorcycle, bicycle, or other means” when trying to learn about who uses a bike to travel to the workplace. Lumping in “taxi,” “motorcycle,” and “other,” along with bicycles makes it harder to draw specific conclusions, especially given the rise of ridesharing during the same time period. However, when looking at the full universe of 16+ DC workers, the category “taxi/other” actually fell from 54% to 31% of the bike/taxi/other overall total. Meanwhile, the share of bicycling commuters went up. So it’s a fairly safe bet that biking is predominately responsible for increases at the smaller demographic level.
Commuting by “taxicab, motorcycle, bicycle, or other means” was among all demographics we looked at, and the difference in growth was particularly pronounced among white respondents (60.75% increase) and black respondents (57.18% increase). We specifically examined demographics where the margins of error didn’t dwarf the data itself, leading to the exclusion of the “American Indian and Alaska Native” and “Native Hawaiian and other Pacific Islander” subgroups.
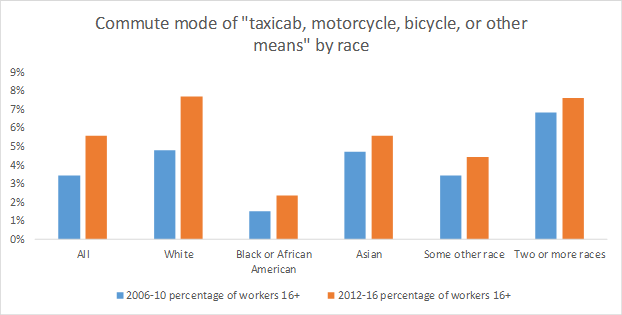
Source: 2006-2010 American Community Survey 5-Year Estimates and 2012-2016 American Community Survey 5-Year Estimates.
Commuting in this category was also up by 42.02% among those who identified as Hispanic and/or Latino.
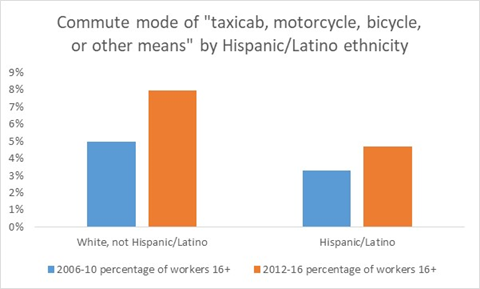
Source: 2006-2010 American Community Survey 5-Year Estimates and 2012-2016 American Community Survey 5-Year Estimates.
Increases held true for all categories of immigration status measured by the Census.
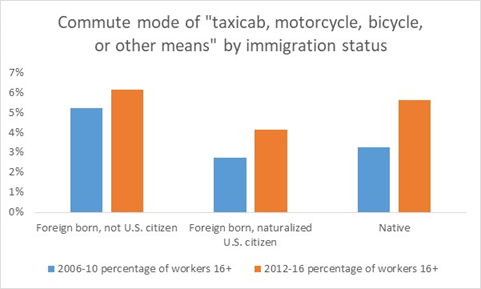
Source: 2006-2010 American Community Survey 5-Year Estimates and 2012-2016 American Community Survey 5-Year Estimates.
Interestingly, commuting by “taxicab, motorcycle, bicycle, or other means” was up the highest among the demographic at 100-149% of the federal poverty level (a 157.74% increase), suggesting that these modes are of particular use for lower- to mid-income individuals.
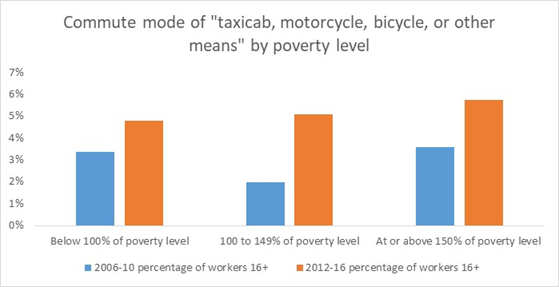
Source: 2006-2010 American Community Survey 5-Year Estimates and 2012-2016 American Community Survey 5-Year Estimates.
The potential bike share connection
So what does the data have to do with the Capital Bikeshare system? Well, it’s likely that the expanding presence of bike share between the two time periods we studied influenced the availability of bikes and the ease of using a bike in DC. In fact, along with new bike lanes, the growth of bike share is probably the biggest bicycling-related infrastructure change over the time period examined. As such, Census data could provide evidence in support of bike share programs for increasing a city’s number of cyclists.
It’s important to note, that many believe Census data actually undercounts the total number of people who bicycle. One reason for this is that people might used mixed transportation modes to get to work, such as bicycling to a bus stop, or walking to a bike share station.
Another reason is that, as we’ve found with bike share, many people prefer to bicycle for recreation and fitness, rather than as a means of getting to work. Or a bike might be used to run an errand, but not to reach work or to come home at the end of the day.
While the data makes it hard to get into specifics, the numbers we have seem to show that a promising trend is underway for a greener, healthier DC transportation future.
The Better Bike Share Partnership is funded by The JPB Foundation as a collaborative between the City of Philadelphia, the Bicycle Coalition of Greater Philadelphia, the National Association of City Transportation Officials (NACTO) and the PeopleForBikes Foundation to build equitable and replicable bike share systems. Follow us on Facebook, Twitter and Instagram or sign up for our weekly newsletter. Story tip? Write stefani@betterbikeshare.org.