NABSA’s 2020 State of the Industry Report Is Here
by Kiran Herbert, Communications Manager
August 10, 2021
The first-of-its-kind release provides in-depth, year-over-year metrics demonstrating industry trends, growth, and success across North America.
All graphics courtesy of NABSA and its 2020 State of the Industry Report.
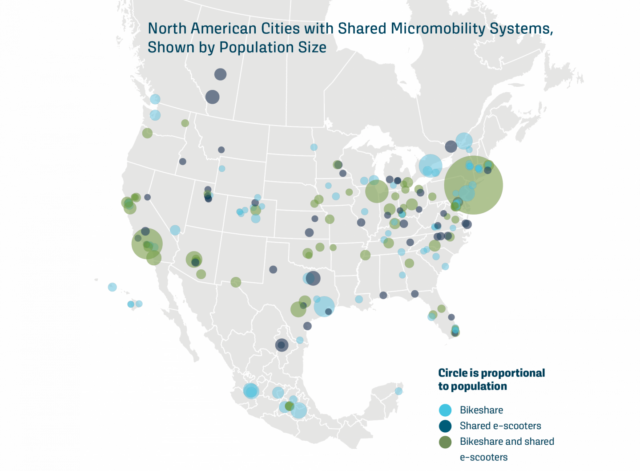
Last week, the North American Bikeshare and Scootershare Association (NABSA) released its second annual State of the Industry Report. NABSA worked with Toole Design and the University of California Berkeley Transportation Sustainability Research Center (TSRC) to help develop the report, using a mix of survey results, statistics gathered from performance reports released by shared micromobility systems, and data from the General Bikeshare Feed Specification (GBFS), the open data standard for bike share.
New for 2020 were the following analyses:
- Workforce diversity initiatives
- A country-by-country breakdown of ridership
- A country-by-country breakdown of vehicle types
- Cost considerations for private operators
- Enhanced public transportation metrics including proximity to transit, transit-related trip-making, and connection to transit
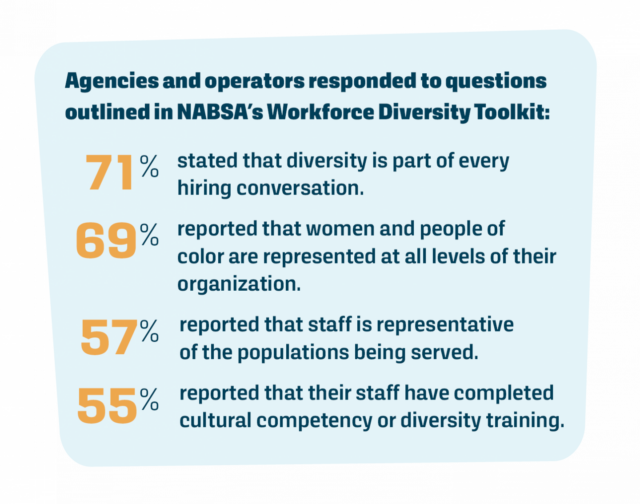 Considering the events of the last year and upheaval surrounding racial justice in the U.S., “workforce diversity initiatives” is a timely addition. The 2020 report demonstrates steps the shared micromobility industry is taking to make organizational changes regarding diversity, including the redevelopment of hiring practices (71% of shared micromobility operators say that they include diversity as part of every hiring conversation). This focus on making impactful change also extended past the workplace as operators supported their communities during demonstrations by maintaining service and providing discounted fares for participants.
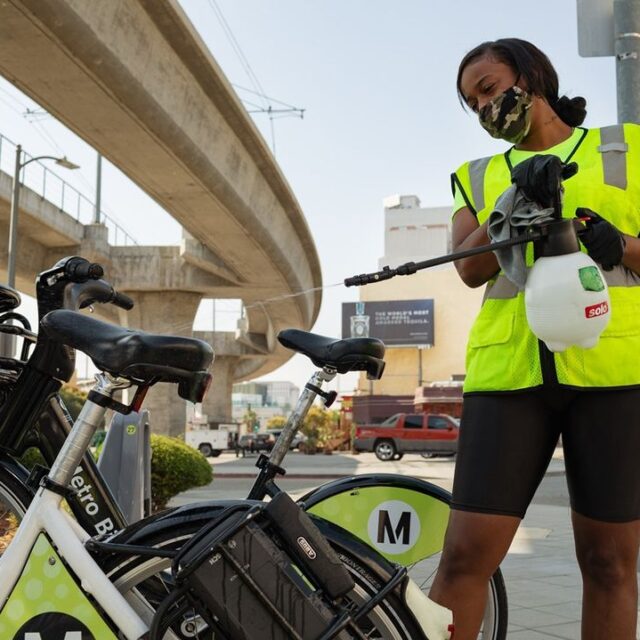
Even without the murder of George Floyd and the protests that ensued, 2020 was an unprecedented year. The report quantifies the impact of the COVID-19 pandemic on shared micromobility and demonstrates the industry’s overall resilience. For example, despite a decrease in ridership in 2020, approximately 50% of shared micromobility systems reported an increase in first-time riders. By the end of 2020, ridership was within 20% of the previous year’s levels, rebounding more quickly than other shared modes.
“2020 was a challenging year for all, however, the COVID-19 pandemic highlighted the importance and resilience of shared micromobility as a transportation option for communities,” says Samantha Herr, NABSA’s executive director. “The report makes clear what we already knew—shared micromobility is an essential component of public transportation ecosystems and will continue to be embraced and grow.”
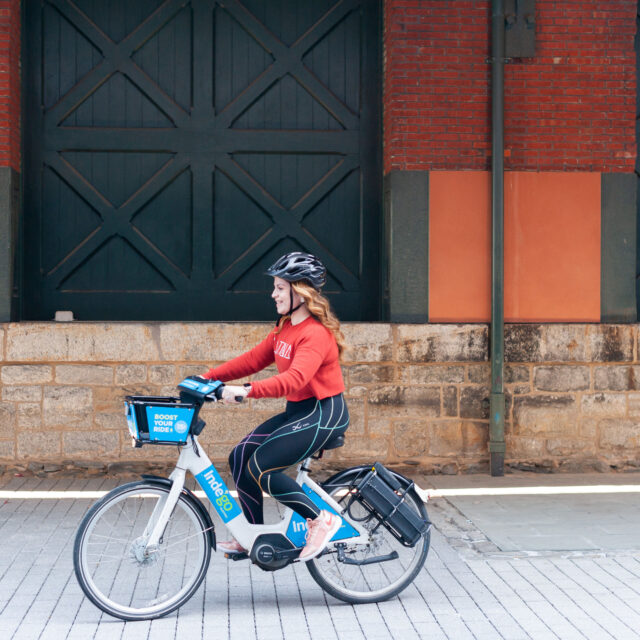
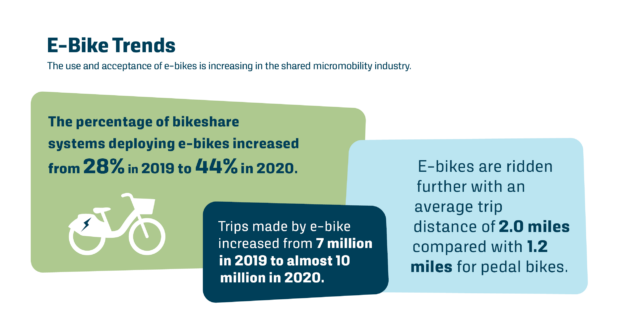
One aspect of shared micromobility that experienced tremendous growth in 2020 was the adoption of e-bikes by systems throughout North America. When compared to 2019, the popularity of e-bikes soared, resulting in 9.9 million trips taken in 2020, up nearly 3 million from 2019. Additionally, the number of available e-bikes increased from 12,000 to 23,000.
The widespread adoption of e-bikes is testament to shared micromobility’s potential when it comes to combating climate change. Compared to auto trips, shared micromobility trips reduce greenhouse gas emissions by 100% on pedal bikes, 97% on e-bikes, and 98% on e-scooters. According to the report, 36% of shared micromobility trips replace car trips and 16% of all shared micromobility trips were for the purpose of connecting to transit. What’s more, shared micromobility trips in 2020 resulted in a reduction of 29 million pounds of CO₂ emissions and 12.2 million additional hours of physical activity by replacing car trips.
The 2020 report also includes, for the first time, economic impacts. A recent study found that e-scooter programs increased unplanned spending at quick service restaurants and food and beverage stores. The study concluded that there was $921 of additional spending per scooter in the six-month study period. Plus, the report estimates that the shared micromobility industry in North America resulted in the creation of an estimated 5,000 jobs. 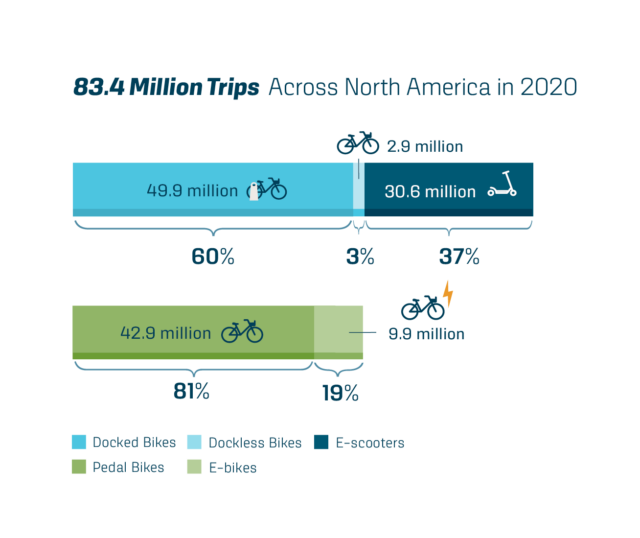
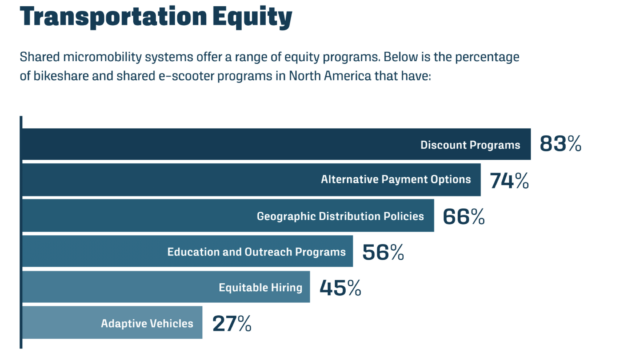
Compared to last year’s report, the biggest changes in terms for ridership came in income, race and gender representation. In 2020, low-to-middle income earners got closer to representation while middle-to-high income earners dramatically increased representation. While white users are still over-represented, there was an increase in representation among Black and Latinx populations using e-scooters. There was also a shift in bike share usage with female participation being closer to representative. Overall, there was better representation of low-income, Black, Hispanic or Latino, and female users, although there’s still much work to be done. The graph below also highlights the need for more equity initiatives, including adaptive vehicles, education and outreach programs, alternative payment options and discount programs.
There’s a lot to dissect in the 19-page report, whether you’re a bike share operator, city employee, or community organization. In order to hear from the report’s creators, NABSA is hosting a “State of the Industry Virtual Discussion” on August 17. Register for the webinar to discuss the new findings, examine the methodology used, and ask questions. To learn more about the important issues facing our industry, consider attending NABSA’s two-day virtual conference “Rolling With It: Empowering Shared Micromobility,” October 27-28.
Download NABSA’s 2020 State of the Industry Report
The Better Bike Share Partnership is funded by The JPB Foundation as a collaboration between the City of Philadelphia, the National Association of City Transportation Officials (NACTO) and the PeopleForBikes Foundation to build equitable and replicable bike share systems. Follow us on Facebook, Twitter and Instagram or sign up for our weekly newsletter. Got a question or a story idea? Email kiran@peopleforbikes.org